SaaS Business
(TOUCH POINT BI)
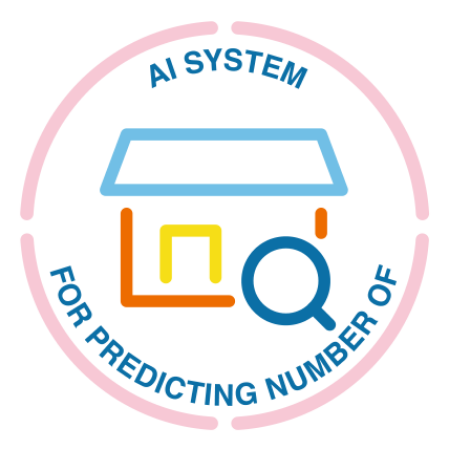
IMAGE ANALYSIS
IMAGE ANALYSIS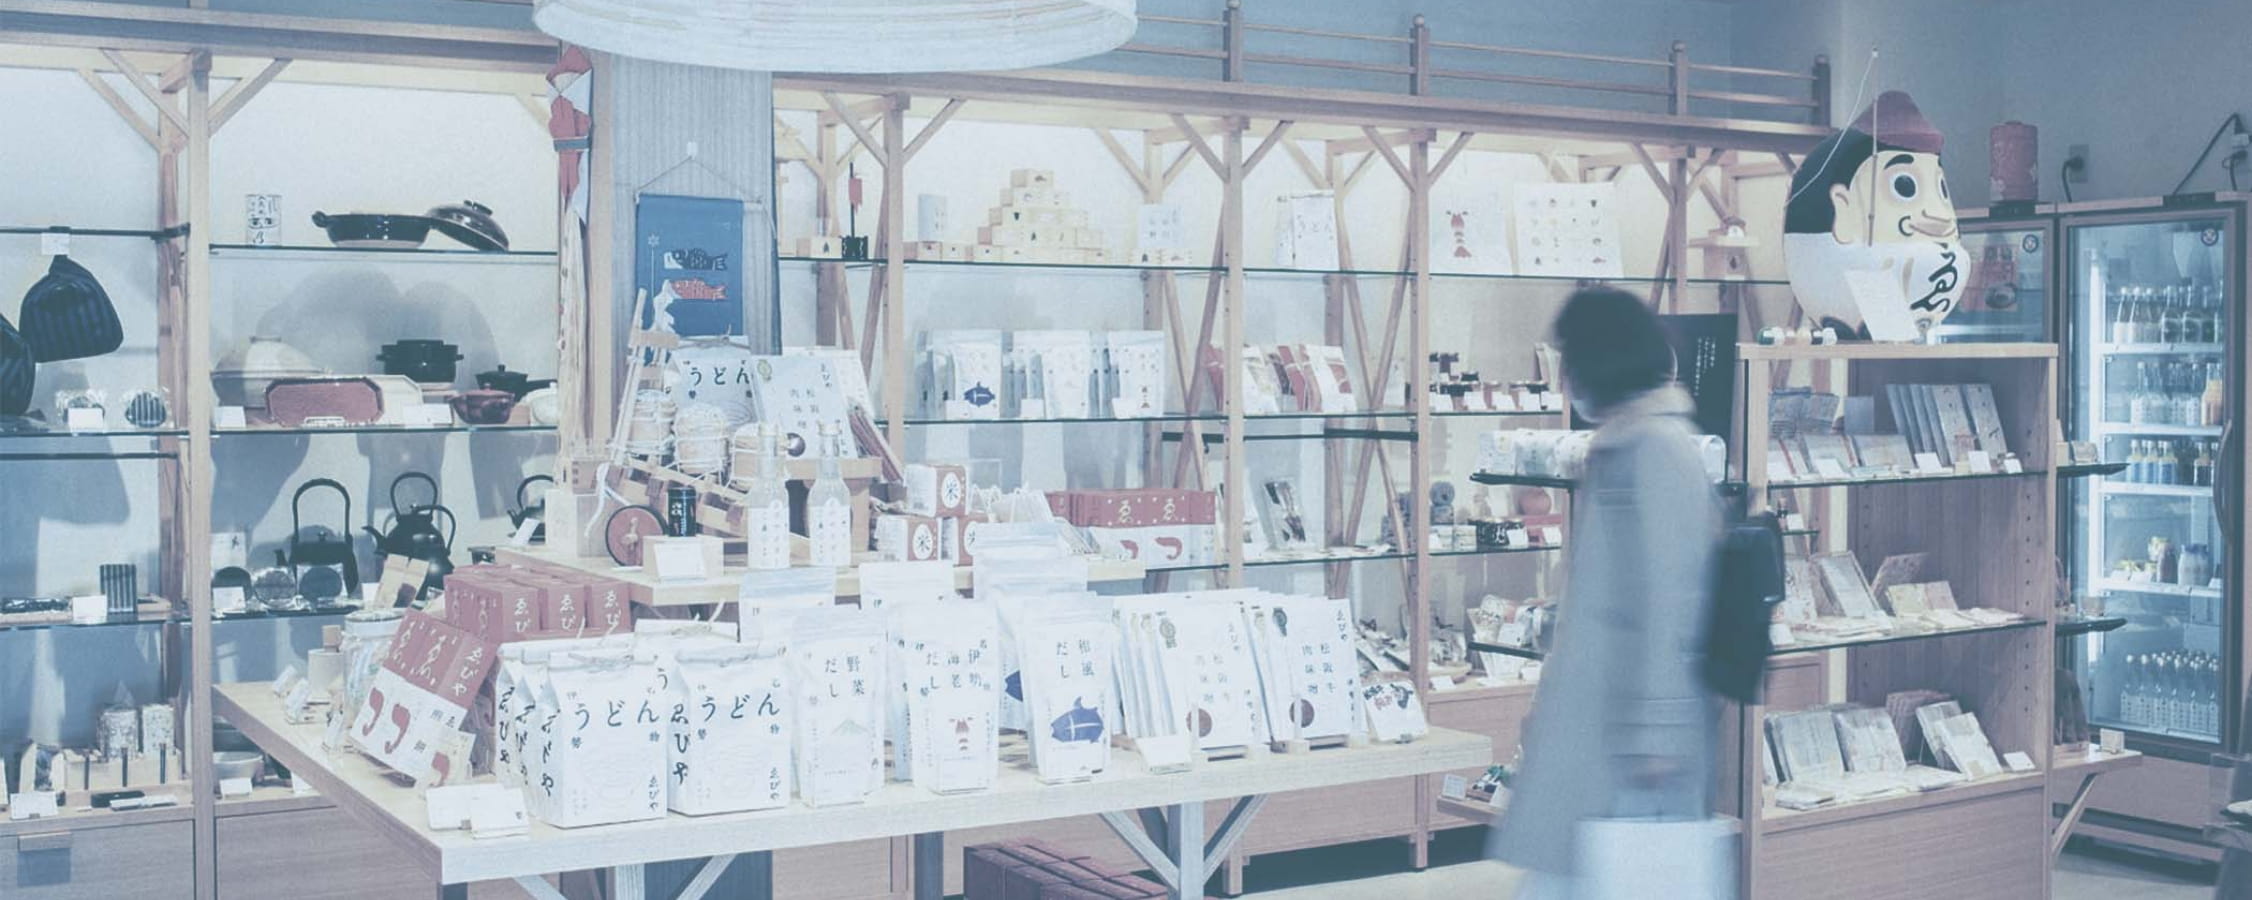
Visualizing
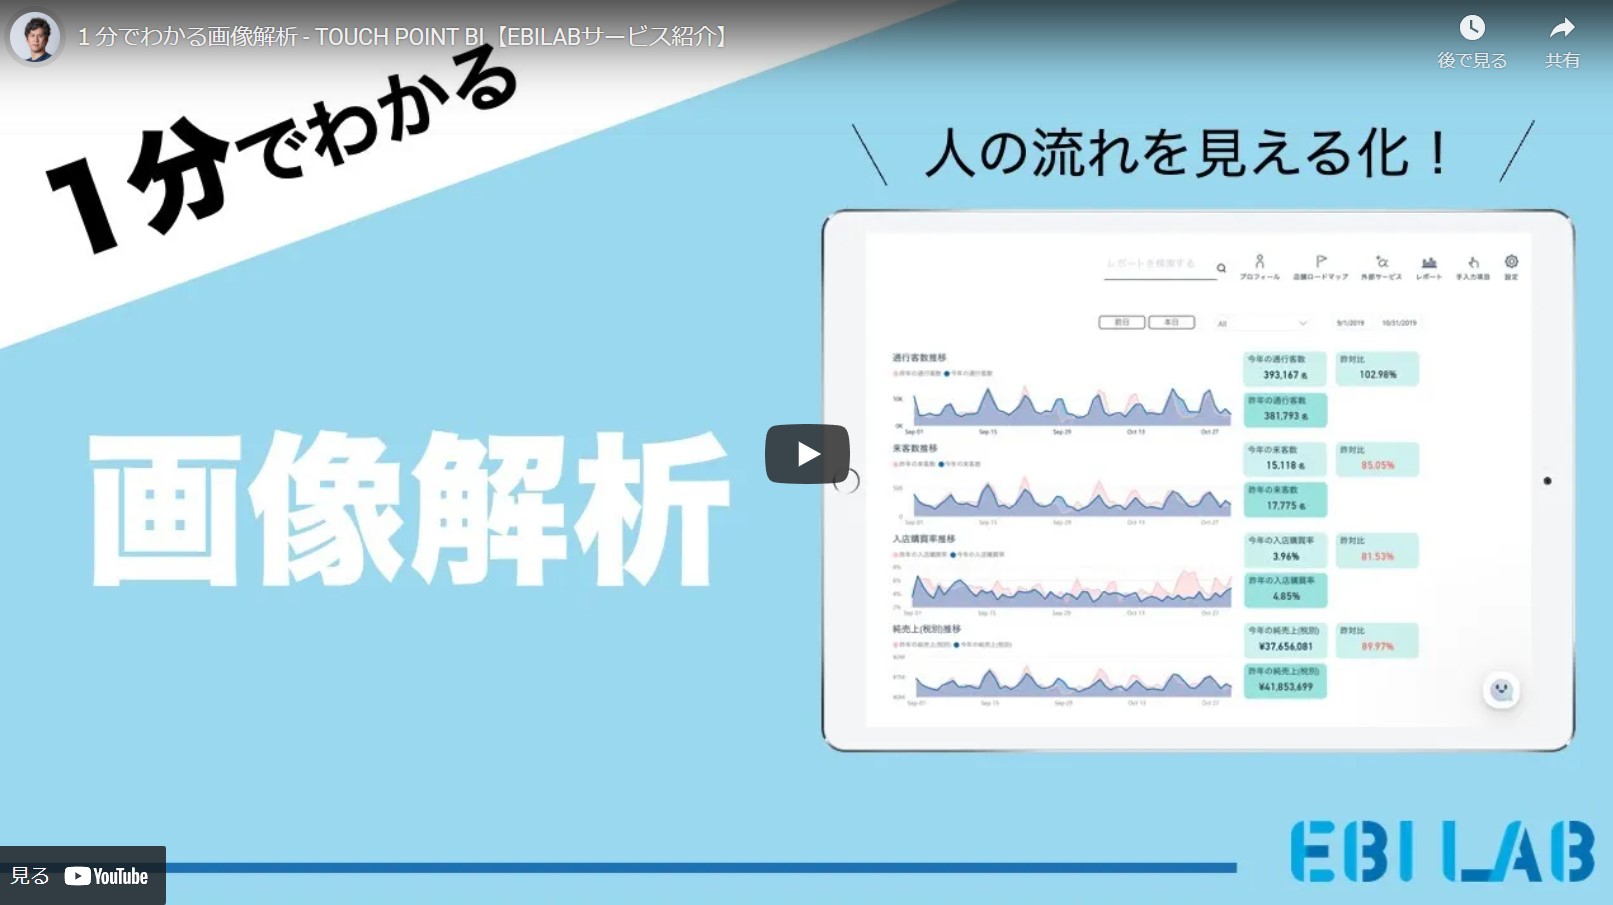
the flow of people through image analysis
Visualize customers in the store and in front of the store with AI cameras and sensors to strategically increase sales
Recommend for the following industries
Restaurants
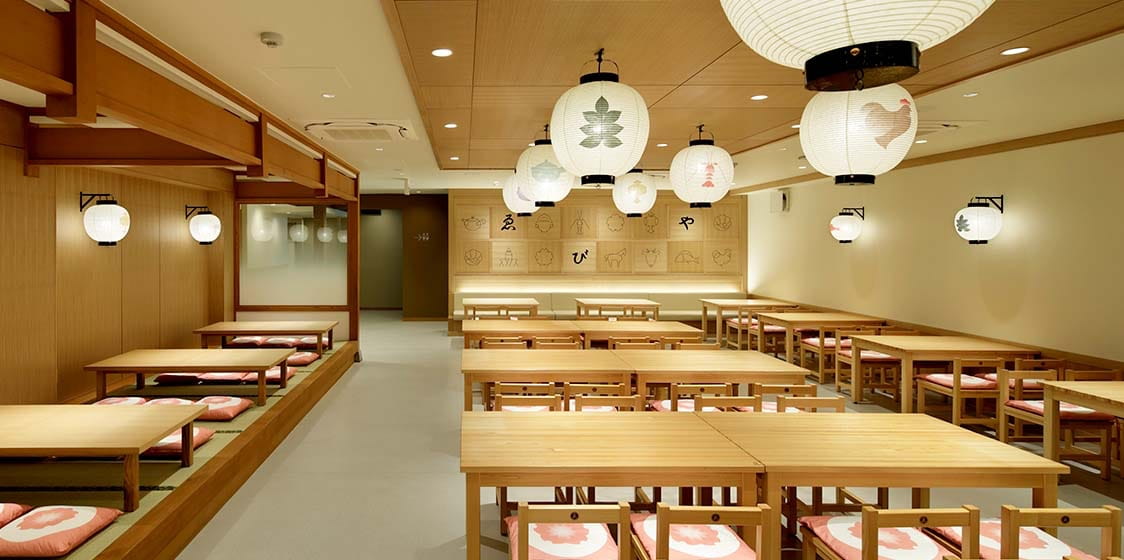

- Know the sales of the store you are aiming for
- Optimization of signage and POP
Retail stores
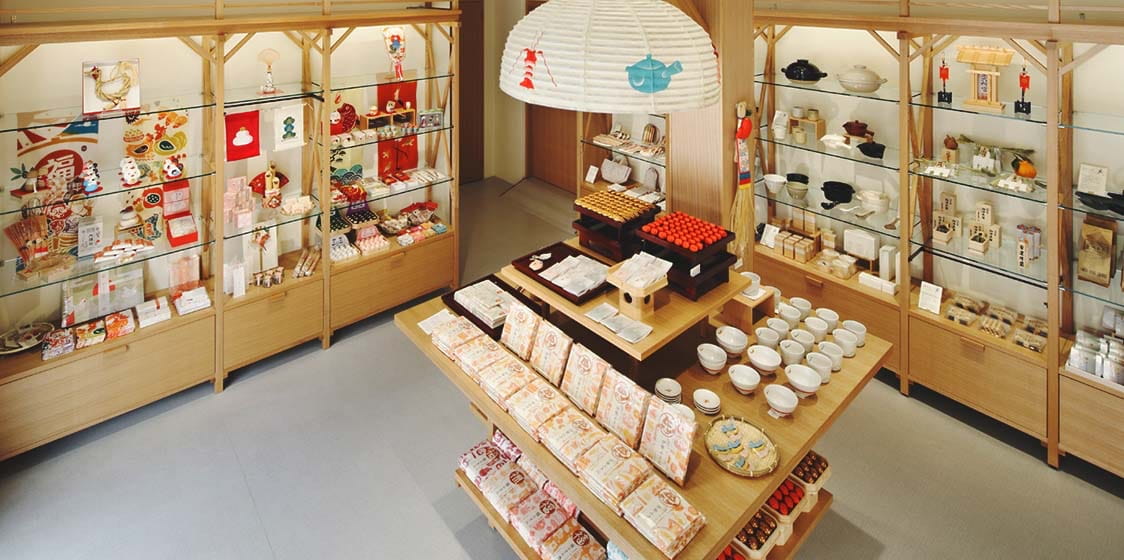

- Understand the sales of stores that can be targeted
- Analyze the customers who are missing out
- Effective measures and sales increase based on the flow of people
Features of EBILAB's image analysis
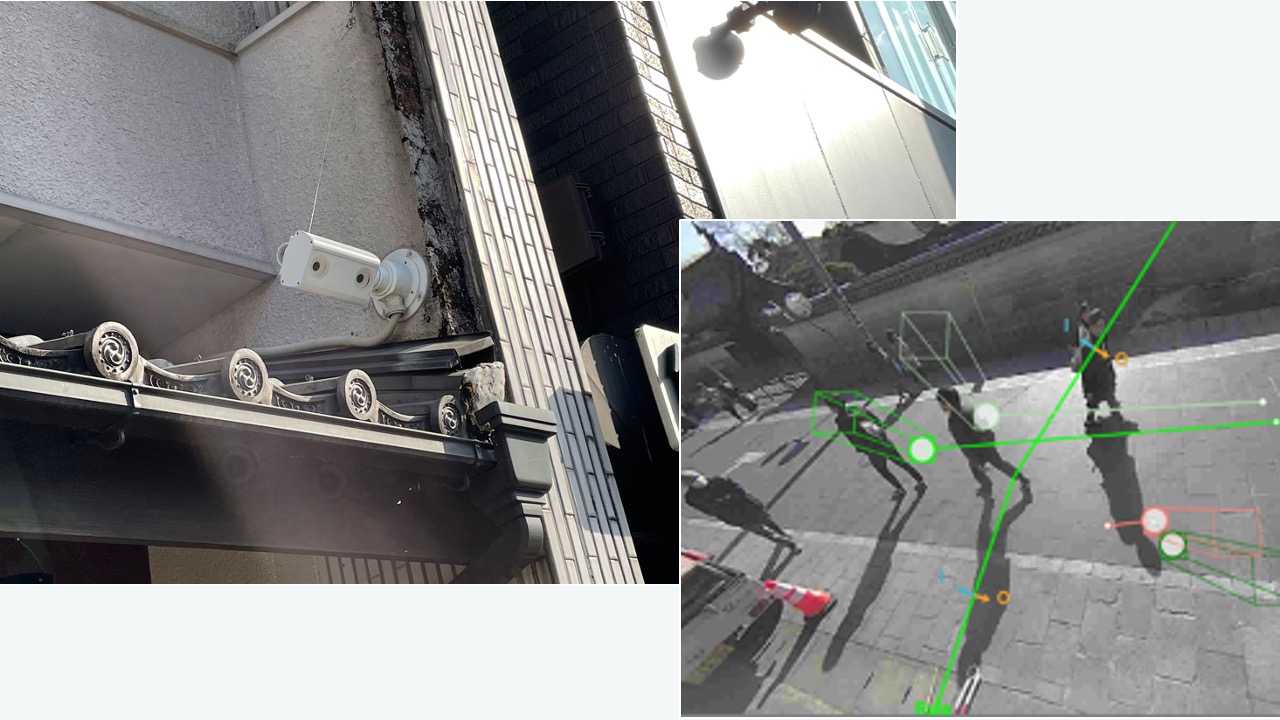
AI cameras installed outside and inside the store measure and analyze traffic volume and customer characteristics. This service aims to increase store sales by reflecting the results in signage, POP, menu structure, etc.
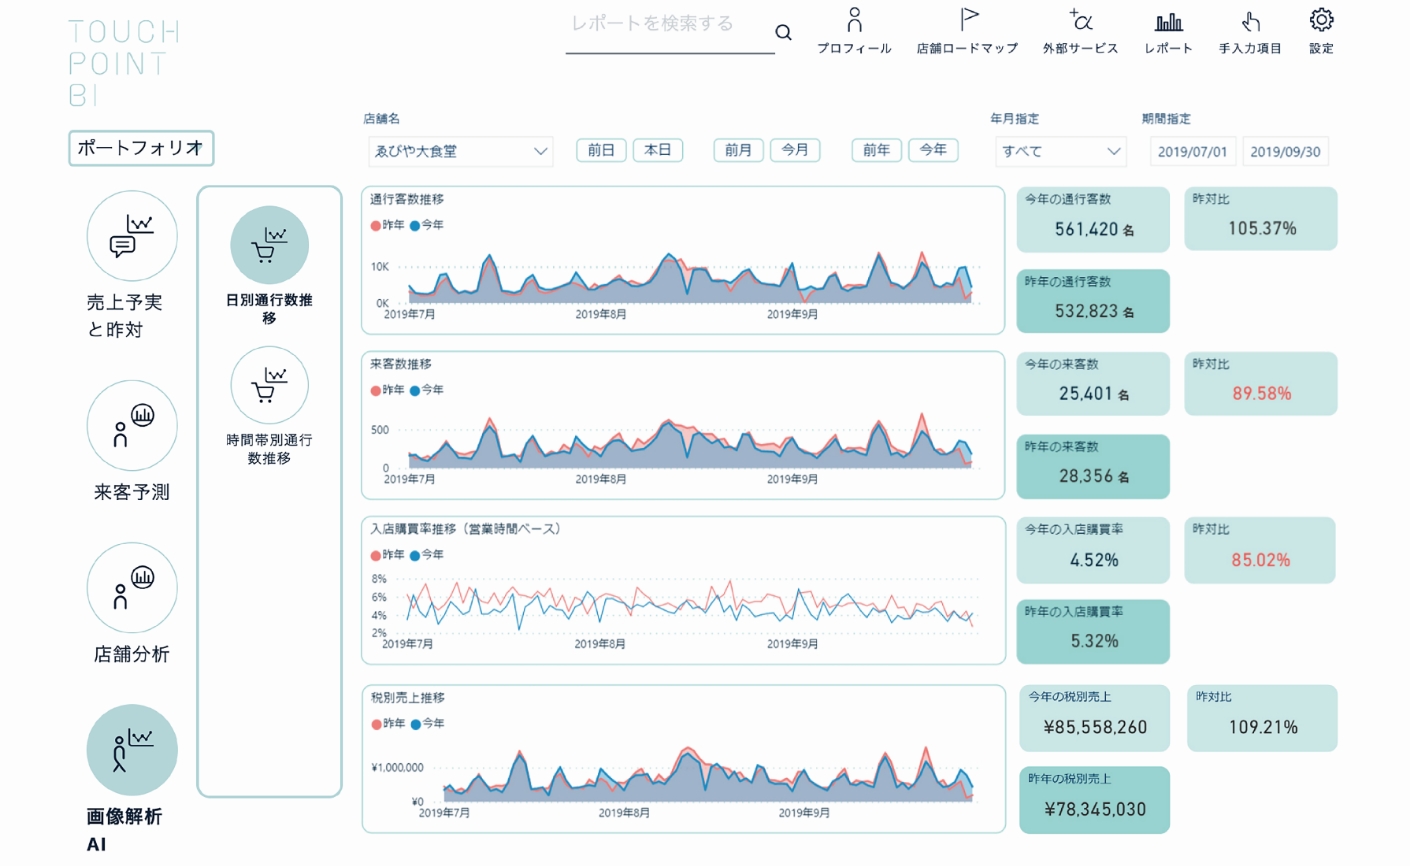
Data on traffic volume and store entry rate
You can take action based on objective figures, not on your experience or feeling.
Features
AI cameras and sensors can help you understand your store.
By installing AI cameras and sensors, we can visualize the number of people passing by, the number of people visiting the store, and their characteristics to properly grasp the situation around the store.
Also, by analyzing the patterns of people visiting the store, you can take action on product planning and sales promotion measures for customers who have been missed, thereby improving the store entry rate and increasing store sales.
Benefits
Visualizing the amount of traffic
Visualize the number of passers-by and their characteristics to properly grasp the situation around the store
Increase customers entering the store
By analyzing the percentage of customers who enter the store, we can identify appropriate signage and POP
Increase sales by analyzing customers
Increase sales by changing the menu and product mix according to customer patterns.
Increased sales through actions based on data, not just intuition
Price Plan
Image Analysis
Visualizing the flow of people using AI cameras and sensors
- Visualize the number of pedestrians and their attributes to understand the situation around the store.
- Analyze the ratio of customers to determine the appropriate signages, posters, and displays to attract them.
- Increase sales by improving menu and products according to the attributes of customers.
1 store per month
19,800yen~
(initial fee 300,000 yen~)
※ The install cost of cameras and sensors will be charged separately.
OPTION
Customer Forecasting
Make Your Store Profitable with Customer Forecasting
- Optimize the number of orders based on customer forecasts. Reduction of food waste.
- Reduce idle time by optimizing shift making.
- Reduce food serving time by optimizing the performance of preparation.
1 store per month
9,800yen~
(initial fee 100,000 yen~)
Store Analysis
Increase your store's sales with store analysis
- Identify popular products and menus in real time. Optimize the qualities of products and menus. Increase sales and sales per customer.
- Visualize the effects of advertisement and make appropriate decisions on investments based on data analysis.
- Reduce the amount of paperwork, such as daily tallying using Excel.
1 store per month
19,800yen~
(initial fee 300,000 yen~)
Communication Analysis
Automatically identify issues in your store from questionnaires.
- Can be used instead of paper questionnaires and automatically collects customer opinions.
- Real-time analysis of customer feedback allows quick improvement of a store.
- Implement effective product development and sales promotion based on customer feedback.
1 store per month
3,500yen~
(initial fee 50,000 yen~)
Application Frow
TOUCH POINT BI can be deployed in your store in just a week after the time of application, Great results will be achieved depending on how well you use the system.
-
Application
-
Login
-
Camera
installation
Image analysis -
Visualization
of foot
traffic volume -
Use of data
in daily work- Discover issues
- Improvement
- Confirmation of results
-
Realizing the
effects of image analysisAs short as 1 week
Display traffic data in as little as 3 days after application